International Speeds Report
2020-2022 TEMPO Bus Lane
Impact Analysis on General Traffic Speeds
A project of Traffic Violence Rapid Response
Introduction
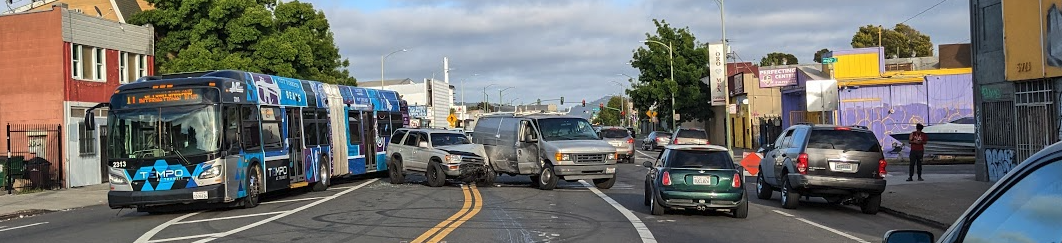
Tragedies along International Blvd, of young and old injured and killed by traffic violence, have mounted in recent years. To understand this trend, Traffic Violence Rapid Response undertook a large-data traffic speeds analysis to examine the crisis.
This analysis reviews roughly 7 million sample speed observations from two two-month long periods before and after the installation of the AC Transit’s TEMPO Bus Rapid Transit (BRT) lanes along International Boulevard in Oakland, California. Critically, the study finds evidence that virtually the entire route alignment saw a marked increase in 85th percentile speeds along this pedestrian-heavy transit corridor post installation.
97.2% of the TEMPO route saw increased vehicle speeds from 2020 to 2022.
Given the configuration of the TEMPO BRT stations, which require pedestrians to cross at least one lane of traffic when both boarding and alighting its centerlane terminals, Traffic Violence Rapid Response (TVRR) believes facility changes, such as standard BRT lane separators, are necessary to protect transit riders from deadly driving behaviors that now represent a significant portion of typical traffic patterns.
In 2018-2019, International had zero traffic fatalities. By 2022, it represented over 25% of all such fatalities in Oakland.
These concerns are underscored by our large data analysis which revealed a number of alarming statistics:
- In 2020, 8.3% of the TEMPO route along International through East Oakland had observed speeds that were at or below the speed limit.
- After the reconfiguration, that figure is now 4.8%, a 42% drop.
- 97.2% of the BRT alignment experienced increased speeds, concurrent with the drop in speed limit adherence.
- 67.4% of the total route alignment saw speeds rise in excess of 20% over their 2020 measurements.
The following document seeks to accomplish the following: introduce the data used to perform the speeding analysis, describe the analysis results, and finally share details on data processing. Based on these results, this document includes recommendations for AC Transit regarding pedestrian safety features that address the concerning findings in this report.
Data Source Discussion
The data used in this analysis was procured from Streetlight Data. This data source, which is sourced from both connected vehicle telemetry and cell phone probe trace data, is commonly used by transit agencies and Departments of Transportation (including CalTrans and AC Transit) in performing traffic speeds and volumes as well as trip generation and attraction analyses. In this analysis, 7,158,390 speed records were utilized to generate speeds for 345 unidirectional measurement gates (257 unique addresses) along the AC Transit TEMPO route between the intersection of 1st Avenue and 141 International Blvd. in Oakland to the northwest and the intersection of East 14th Street and Garcia Avenue in San Leandro to the southeast.
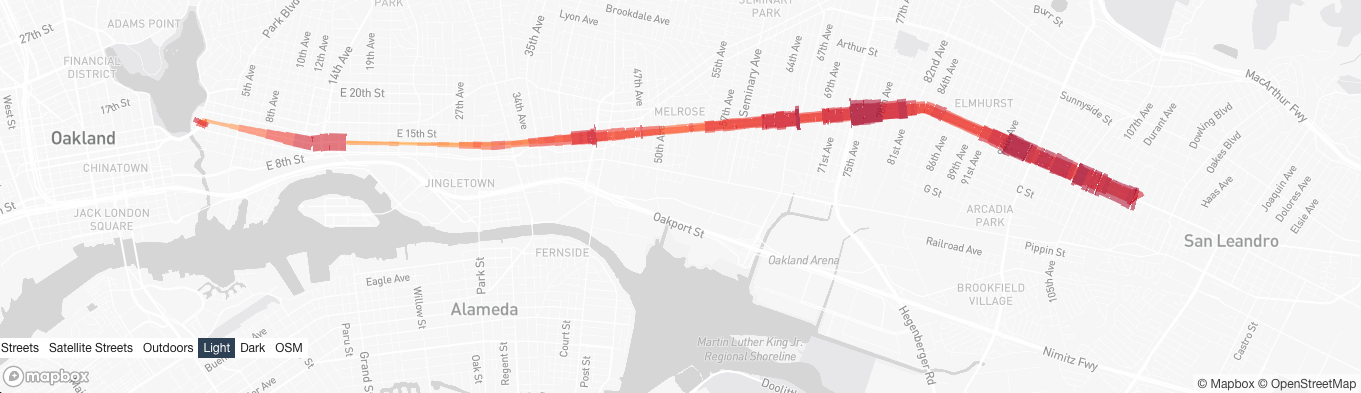 Above: Map of the distribution of sample speed data along the total length of the analyzed route paths (both eastward and westward directions). Color and width (darker, wider) indicate relatively greater volume of vehicle speed observations on those segments.
Two time periods are analyzed, representing January - February 2020 as the first control period and May - Jun 2022 as analysis period. Due to limitations in our organization’s data acquisition capacity, the two periods were not able to be the same two month-long periods for the two target years. However, given the highly active land use along the corridor and year-round nature of the commercial thoroughfare, the author assumes that speed fluctuations along International from seasonal changes should be relatively small.
A final technical note regarding the two time periods: The 2020 data is primarily based on location-based service (LBS) data acquired from partner mobile applications that provide high-resolution geographic trace data. The 2022 data is primarily based on connected vehicle data (CVD), which is sourced from in-vehicle OEM telematics. Prior analyses on the two datasets have observed broad patterns of slightly higher estimated segment speeds in CVD-based data. That said, the scale of this relative delta is minor relative to the magnitude registered in our 2020 to 2022 datasets. Subsequent research may seek to “price in” the effects of transitioning from LBS to CVD; however the general conclusions from this report should not be significantly impacted by such analyses.
Results
The section of route analyzed in this report runs along the AC Transit TEMPO route East Oakland alignment beginning at the 1st & International intersections by Lake Merritt through to the San Leandro border. Analysis results demonstrate that virtually the entire corridor saw a significant increase in speeds. In fact, the average speed change (weighted by segment distance) along the total corridor was a 20.5% increase.
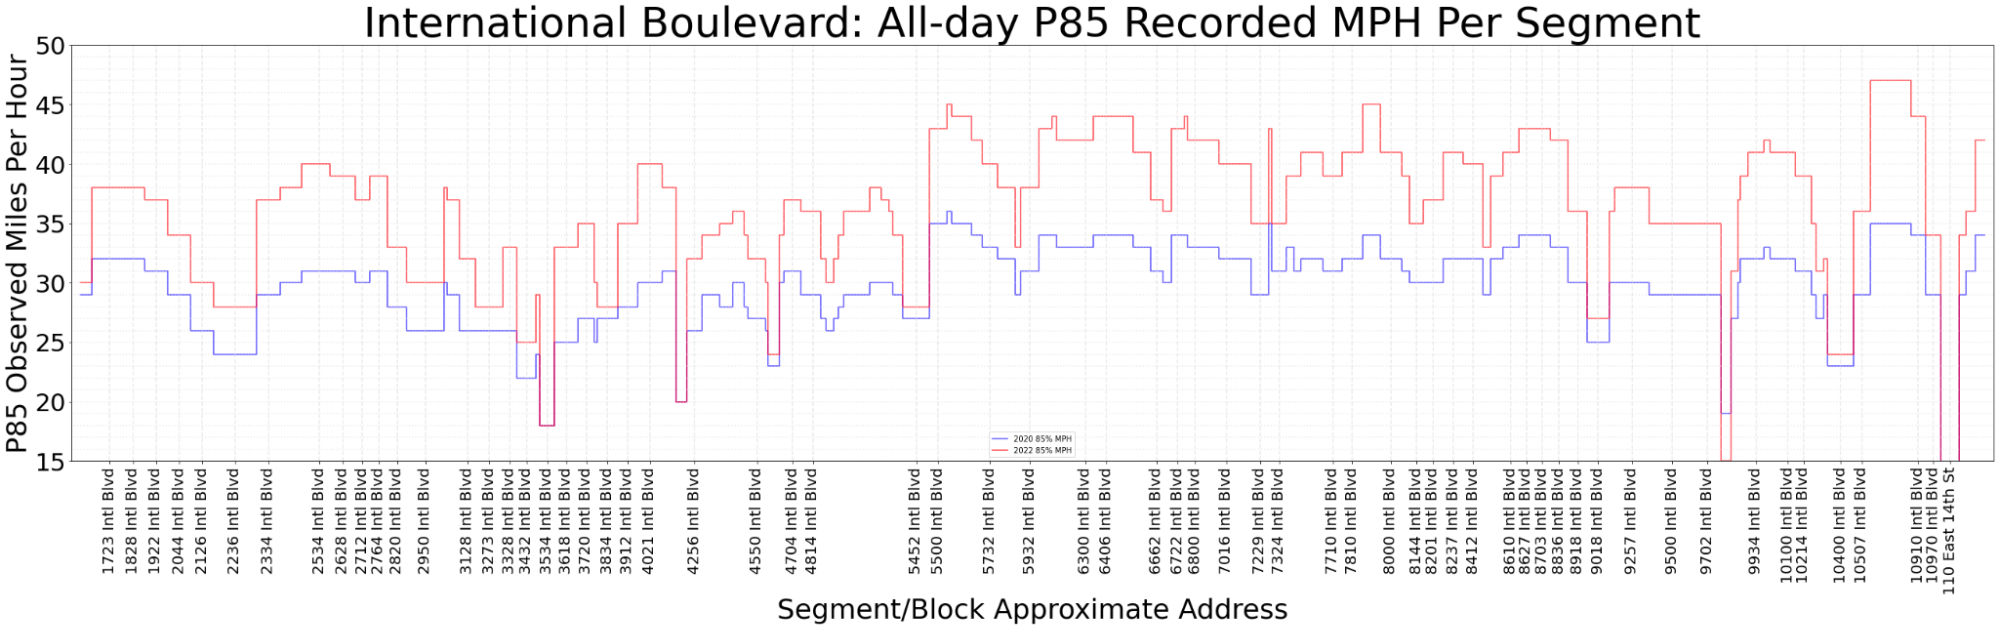 Above: Red line indicates the maximum observed 85th percentile (P85) speed along each segment of the TEMPO alignment (International Blvd.) in 2022 when reviewing speeds from both directions (eastbound and westbound). The blue line indicates the same value, but for data from the 2020 review period. X-axis labels indicate approximate addresses for each block of International.
The magnitude of the increase across the entire corridor length becomes clear when plotted as in the above figure. Note that the x-dimension is a function of route distance as it heads eastbound towards San Leandro from the 1st Ave intersection by Lake Merritt. Also note that, when comparing afternoon rush hour to all-day 85th percentile speeds in 2022, we found minimal differences.
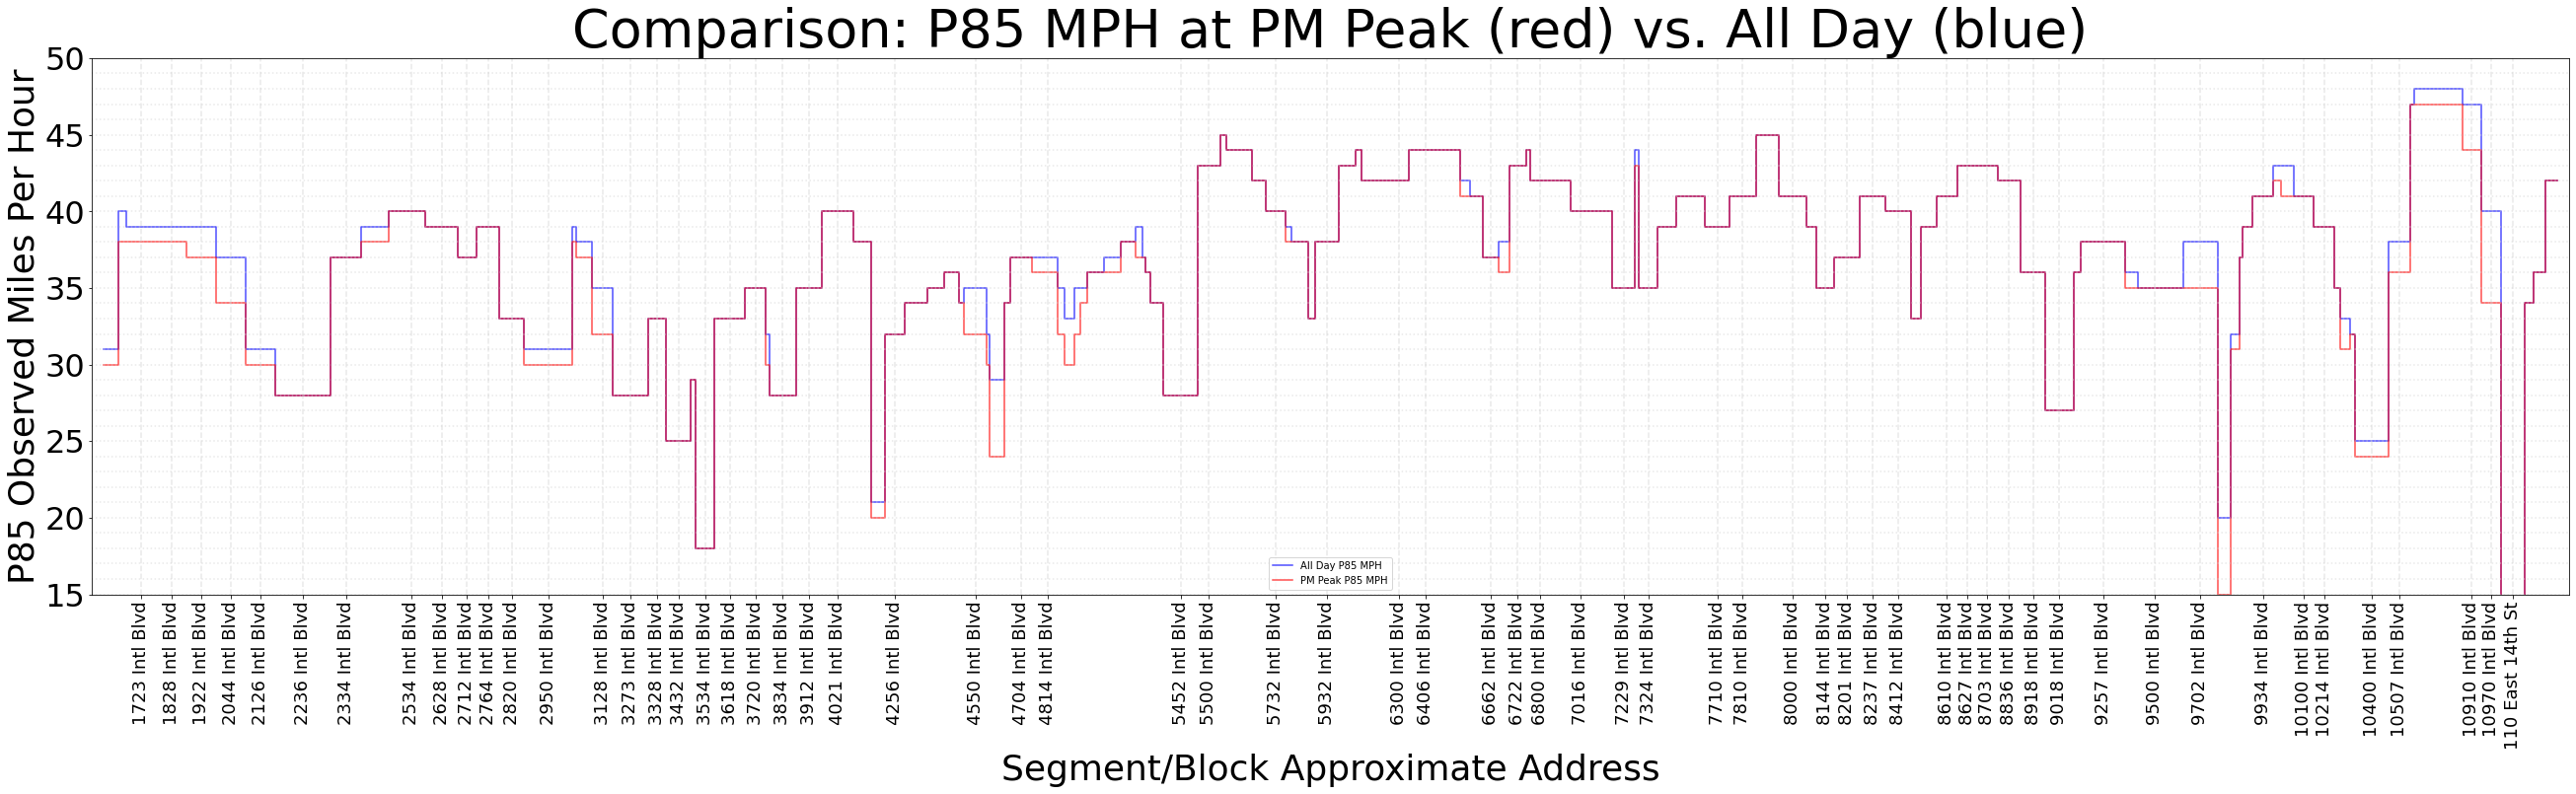 Above: In red are PM peak speeds (MPH) observed per segment of International. The blue line indicates the same measure, but for all-day statistics
The lack of a significant difference between all-day speeds and PM peak hour speeds indicates we can use our all-day figures for this analysis without requiring a second peak-hour specific analysis. Given the distribution of pedestrian fatalities and severe injury, which tend to occur throughout the day and into the evening periods, our crash data would appear to support this conclusion as well.
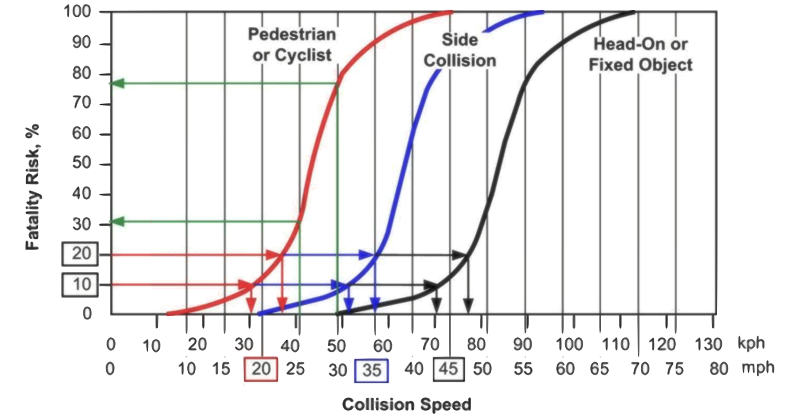 Above: Risk of pedestrian fatality as a function of vehicle impact speed: “20 is plenty.” Source: Wramborg P, A New Approach to a Safe and Sustainable Traffic Planning and Street Design for Urban Areas, Road Safety on Four Continents Conference, Warsaw, 2005.
Having measured the absolute change, we turn next to a review of relative change. That is, what was the proportional change in speeds in 2022 relative to 2020? Large changes in speeds up from relatively lower speeds will be amplified - highlighting areas where speeds were low and thus closer to safe speeds in cases of pedestrian impact (but now are no longer so). NACTO, as well as broader research, regularly cites Department for Transport: London’s Transport Research Lab work that highlights 20 MPH as the threshold at which vehicle speeds become far more likely to be fatal with every incremental increase in speed.
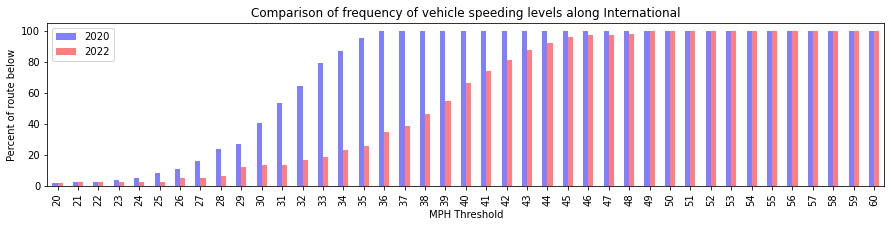 Above: Comparison of 2020 (blue) to 2022 (red) in terms of the portion of International that has speeds below the speed (MPH) threshold incrementing along the x-axis.
To that extent, seeing what portion of this critical transit corridor - and therefore pedestrian corridor - falls within even remote grasp of that safe speed becomes critical. By viewing the portion of roadway available for access as a function of speed (MPH), we can compare 2020 to 2022 and see the distribution of the regression that has occurred.
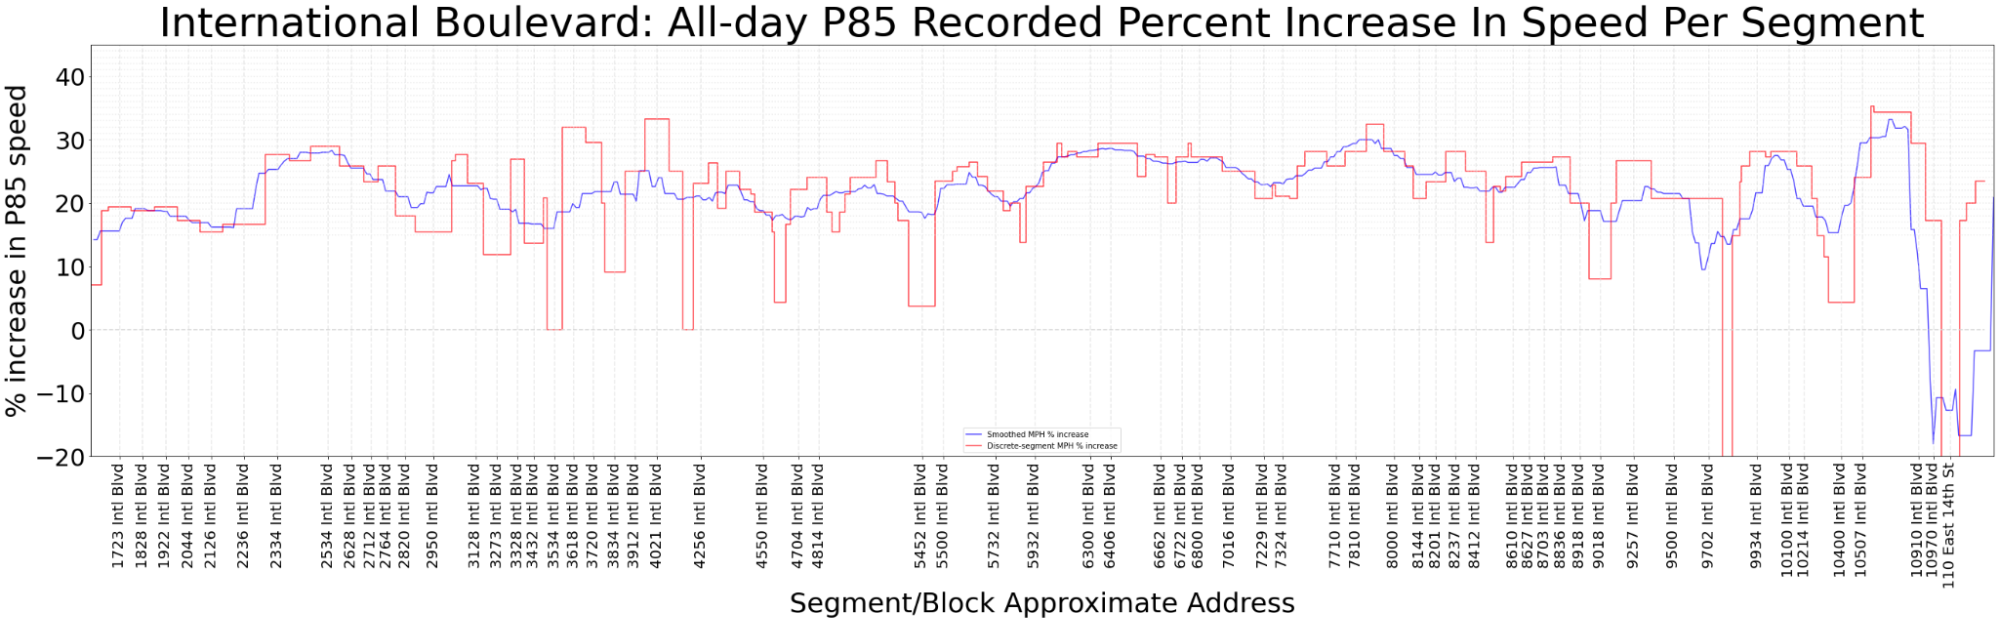 Above: Moving-average percent change in speed from 2020 to 2022 over the length of the route alignment (blue) paired with discrete proportional change on a per-block basis (in red).
Looking at percentage change in speeds between 2020 and 2022, we can calculate both a moving average throughout the corridor (blue line in the above figure) as well as review the percentage changes on a block-by-block basis. The smoothed percentage change plot highlights one area of apparent sustained speed reduction which appears to occur right south of the entrance to San Leandro. It is worth noting that this final segment of the analysis area was also the only portion to not receive the installation of the unprotected bus only lane design that was installed through East Oakland.
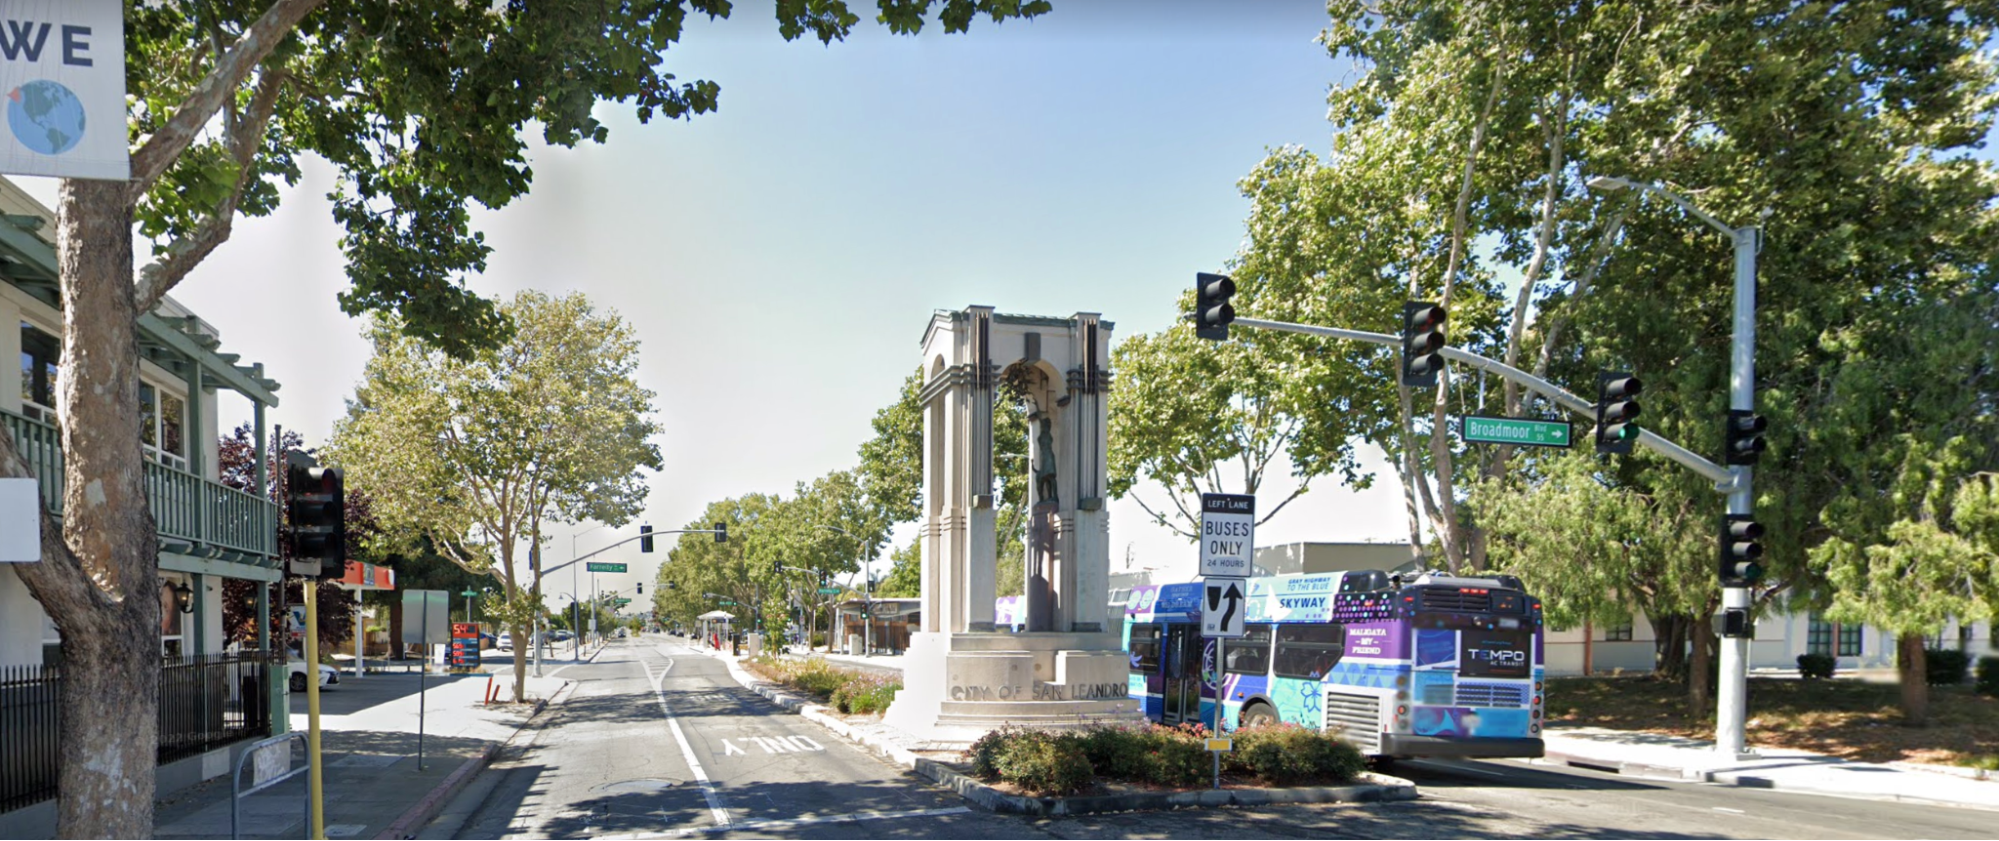 Above: The block of TEMPO’s route heading southeast from the portal into San Leandro along East 14th was one of only two blocks along the entire TEMPO BRT right of way that saw a decrease in speed from 2020 to 2022. Nearly the entirety of the Oakland portion of the TEMPO right of way analyzed saw marked increases in vehicle speed. Image via Google Maps.
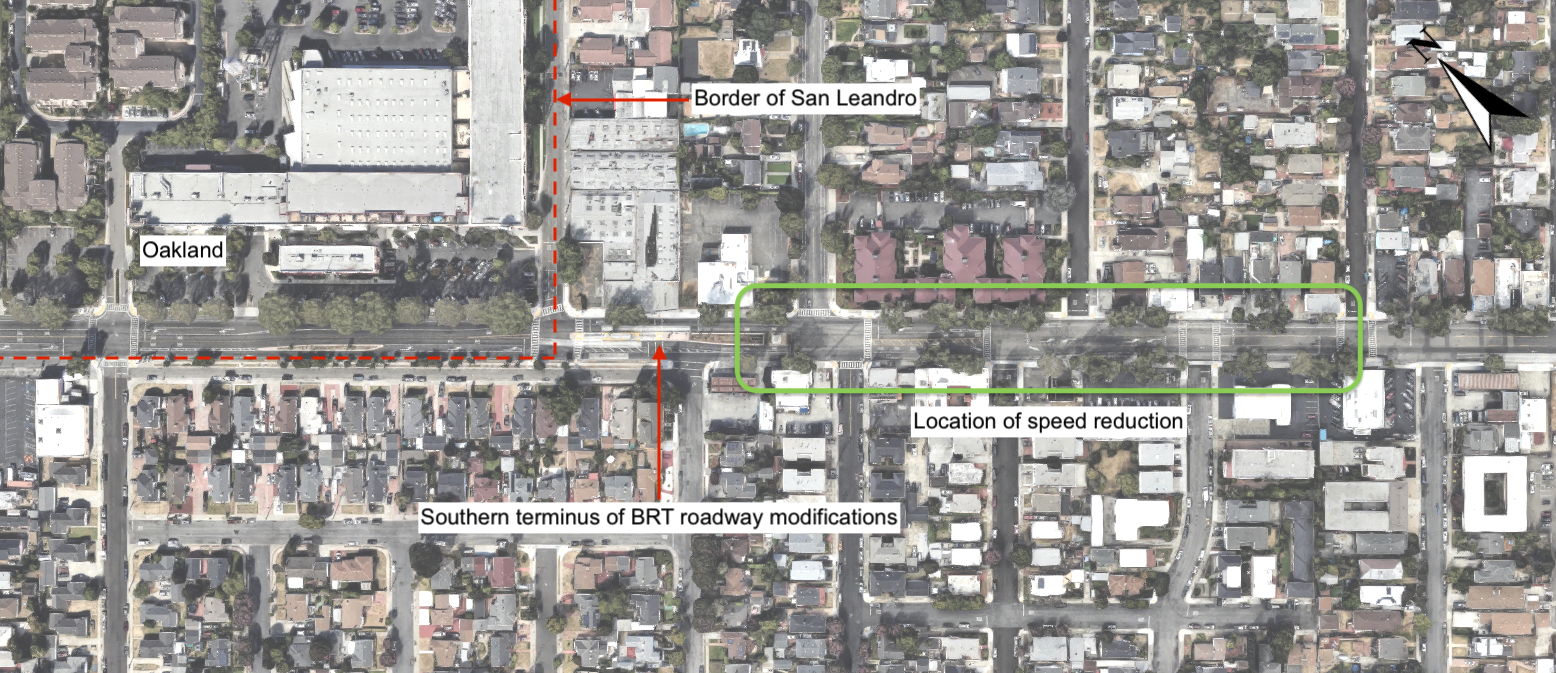 Above: Map of the Oakland-San Leandro border with zone of observed speed reduction highlighted in green and the municipal border in a red dashed line. Note that speed reduction occurred just south of the end of the roadway modification project that introduced bus-only lanes north of the Oakland-San Leandro border.
Conclusions
This analysis demonstrates a clear correlation between the installation of the BRT lane and a spike in pedestrian fatalities on International Blvd. After the installation of the BRT lane without safety barriers, the International corridor went from near-0 fatalities (in 2018 and 2019) to one-quarter of all pedestrian fatalities on Oakland’s streets in 2021-2022. The years following its opening have reversed a decade-long trend of falling traffic fatalities.
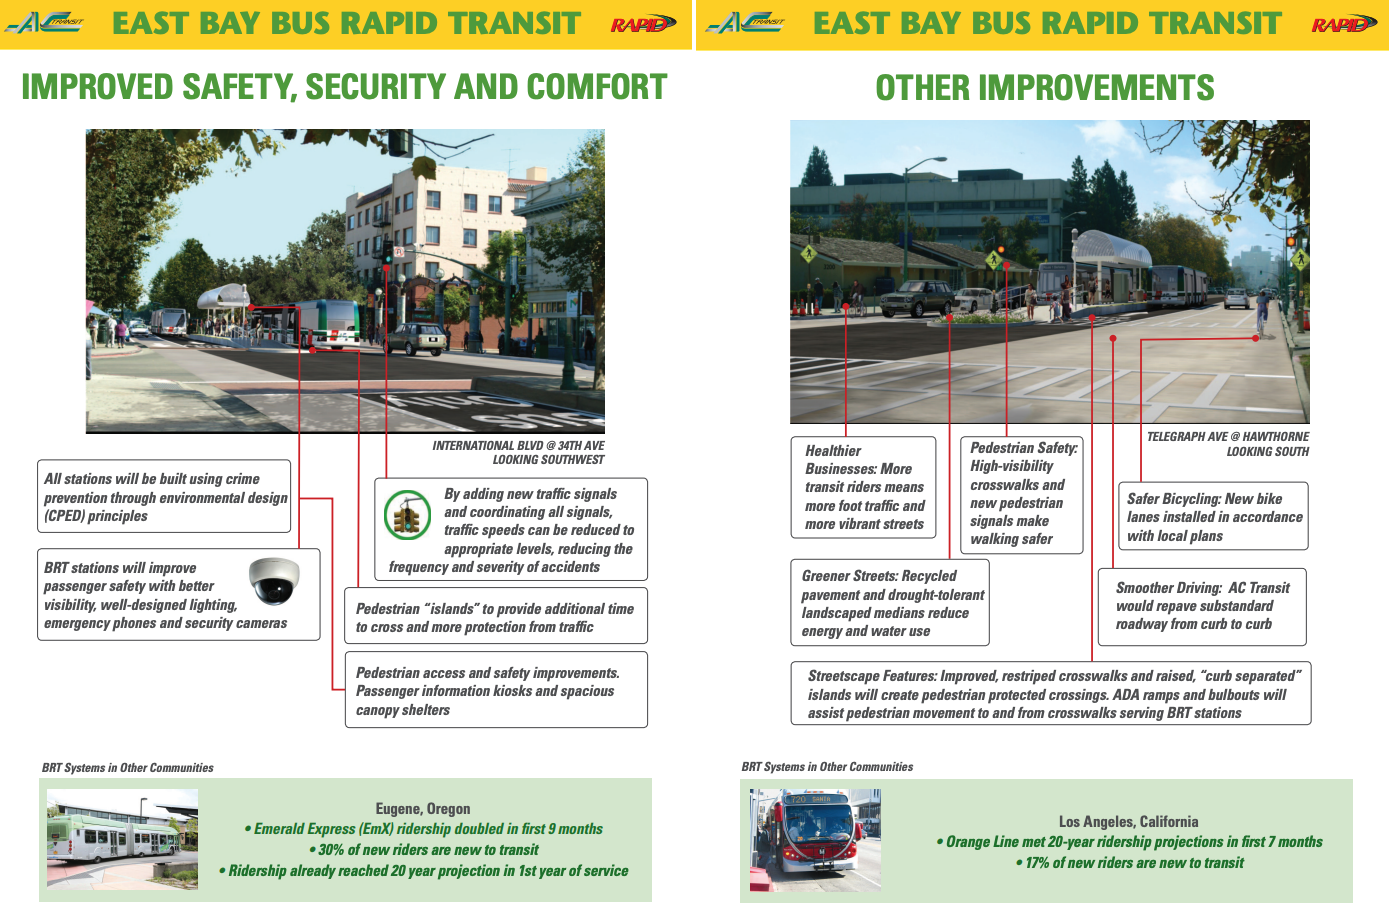 Above: Excerpts from AC Transit’s public repository of outreach materials from community meetings during the EIR process in Spring of 2012.
The original TEMPO BRT project was sold to communities as a bus reliability project with built-in pedestrian safety features. During outreach, the project specifically highlighted “Streetscape Features” including “raised, ‘curb separated’ islands” to “create pedestrian protected crossings.” These were never installed fully or correctly. The curb separation is non-existent along the entirety of the TEMPO alignment. This analysis suggests that the lack of pedestrian safety features have also correlated with a significant human toll,as we see International’s increase from virtually none of the traffic fatalities during construction to now well over a quarter of all such deaths in Oakland in 2022.
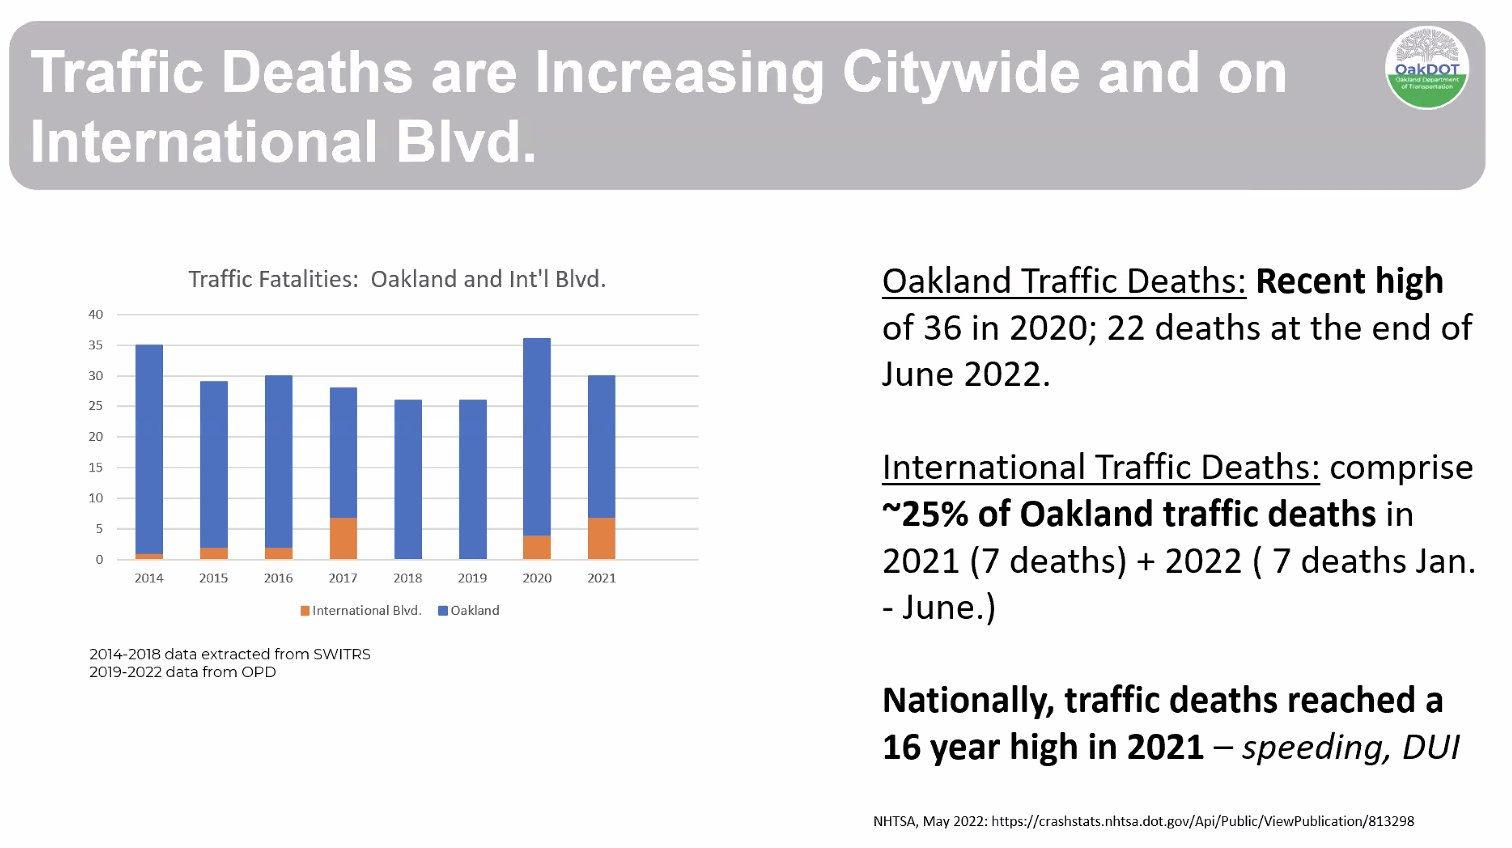 Above: Screenshot from a July 2021 AC Transit Board meeting report delivered by OakDOT highlighting the extreme increase in both deaths broadly from traffic violence as well as International’s role in that in the wake of TEMPO’s opening.
Given that the analysis period falls far enough outside the immediate effects of the COVID-19 pandemic and that commercial activity has largely resumed along this commercial corridor, decreased traffic alone cannot explain the magnitude of increase in traffic speeds seen before and after the BRT opening. Furthermore, reduced speeds in San Leandro for vehicular traffic highlight the imbalance in travel patterns and provide a control for road segments that did and did not receive TEMPO’s uncontrolled bus-only lane design treatment.
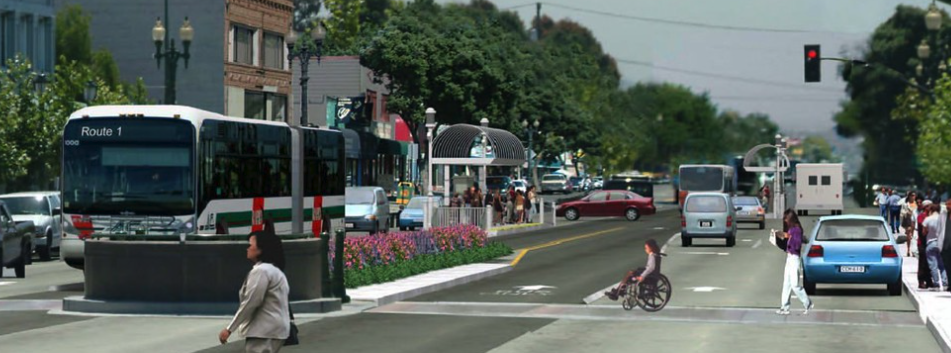 Above: In the approved environ_03mental impact report (EIR), raised concrete curb separators between the bus lane and the general traffic lane were specified, when they were not otherwise separated by other street elements.
The International BRT lane installation is not only incomplete with respect to how it was originally proposed to the community, but it also lacks the lane separation that is standard on any international-grade BRT project. This physical separation, typically achieved with concrete separators such as parking curbs arranged linearly, deters private vehicle misuse and speeding through the bus lane. It is worth noting that this is not only an international standard, but has become a recommendation of NACTO as well, via their APTA Standards Development Program. Furthermore, the physical separation element was included in the approved EIR and was only removed after the EIR process had concluded. Thus, the installed design contradicts the design approved by council and reviewed via public engagement.
Recommendations
Based on this data analysis, we request that AC Transit:
- Accelerate the installation of physical lane delineators in light of continued extreme rates of death and severe injury on International. Example incidents in the last few weeks:
- Two incidents resulting in pedestrian fatalities in June 2023 at 91st and 98th, after the decision to install flex-posts but prior to implementation.
- One driver was killed on June 24, 2023 on the 2300 block of International Boulevard.
- Protect multimodal design guidelines and ensure staff adhere to AC Transit pedestrian safety policies.
- For example, the Grand Avenue corridor 35% design scheme has rejected virtually all road diet and pedestrian safety requests that were general consensus among City of Oakland, adjacent communities, and neighboring institutions largely due to staunch opposition from AC Transit staff and in contradiction with its own internal design policies.
- Deprioritize staff pursuit of internal focus on speed-at-all-costs policies in urban areas.
- Speed is a second order influencer of mode choice and should come after focusing on pedestrian safety (both egress and ingress as well as last leg foot journey to destinations) and service volume in highly activated land use contexts.
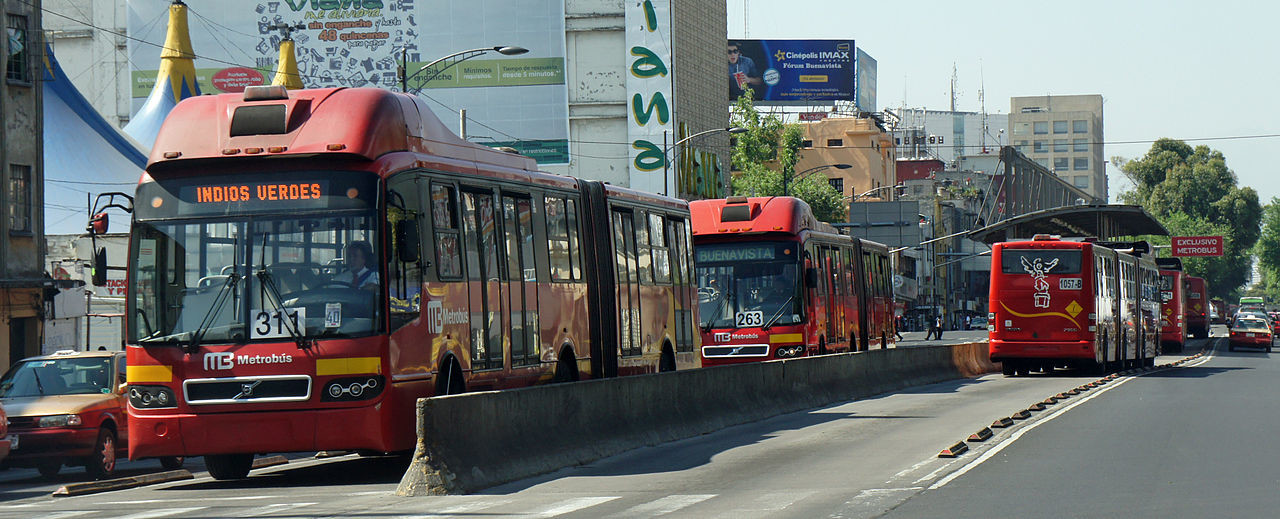 Above: Standard linear curb stop installation in Mexico City to separate BRT right of way from general traffic lanes.
References
- “Designing Bus Rapid Transit Running Ways .” American Public Transportation Association (APTA), Oct. 2010.
- The Law Offices of Daniel Kim. “Man Killed in DUI Hit-and-Run Crash on International Boulevard [Oakland, CA].” Car Accident Lawyer Daniel Kim - Personal Injury Attorney in California, 26 June 2023, usaccidentlawyer.com/news/man-killed-dui-hit-run-crash-international-boulevard-oakland-ca/.
- Lee, Amber. Family of 73-Year-Old Grandmother Killed by Hit-and-Run Driver in Oakland Demands Justice, 19 June 2023, www.ktvu.com/news/family-of-73-year-old-grandmother-killed-by-hit-and-run-driver-in-oakland-demands-justice.
- “June 2023 Meeting Agenda” Oakland Bicyclist and Pedestrian Advisory Committee, 15 June 2023. StreetLight Data, https://www.streetlightdata.com/, Accessed 26 June 2023.
![]()